 Autumn is taking an almighty long time to get underway this year. Global warming isn’t all melting glaciers and rising sea levels; there are some benefits to be derived from it as well, at least thus far. But the temperatures are dropping and the space heating systems are beginning to crank up again all across the UK.
 And always at this time of year condensation starts rearing its mouldy head once more. Across the country, there are outbreaks of dripping bedroom ceilings, rank clothes in cupboards and smelly, dank carpets.
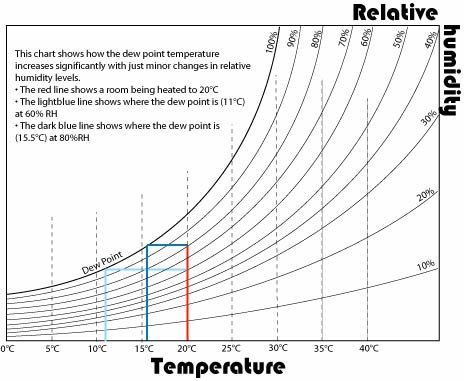
In an attempt to shed a little light on the matter, I have included a free-to-download psychrometric chart, which enables you to predict dew points. If you can’t actually see it too clearly, click on the chart and it should open in a separate window, which should allow re-sizing.
So what is a psychrometric chart? What it shows is the amount of moisture that can freely float around in the air at any given temperature. The topmost curved line represents the saturation point, or the 100% relative humidity level. If there is more water vapour than the air can hold at the given temperature, then the vapour condenses. That is the basic mechanism behind condensation.
Now most homes aim to be around 20°C, at least when the heating is turned on. And most British homes happily subsist at relative humidity levels between 40% and 60%. These are what we would instinctively call comfortable. Now, if you turn the heating off and let the temperature fall, without changing the air in the room, the absolute amount of water vapour in the room is unchanged but the relative humidity level starts climbing. As the room gets colder, the RH level gets higher and higher until eventually it reaches saturation or dew point. On the chart, you draw a line westwards from the nice comfy 20°C, 60% RH, and you can use this to predict at what temperature condensation will start happening. The blue lines show two scenarios for a cooling room.
If you are suffering from condensation, I suggest that the first tool in your armoury should be this chart. Next get a cheap hygro-thermometer from someone like Thermometers Direct. This will tell you what is happening in each room in terms of both temperature and relative humidity. Armed with these, you are ready to become a moisture sleuth. You yourself can work out just why exactly you are getting condensation. And what you need to do to avoid it happening in future.
Keeping the room warm enough to prevent any surfaces reaching dew point is an obvious way of stopping condensation. But some badly insulated walls and ceilings can be difficult to keep sufficiently warm– remember condensation usually starts on the coldest surface. The other method used to eliminate condensation is to reduce the amount of water vapour in the room: at its simplest, this means opening a window and exchanging the warm moist air inside with some cold damp air from outside. Whilst this may seem counter-intuitive, the chart shows that the cold air outside holds far less water vapour, even though it may be close to saturation. More expensive options include whole house ventilation systems that can be an almighty hassle to fit into an existing house.
There may be some very simple solutions staring you in the face such as keeping all the internal doors open and thus evening out the humidity levels across the whole house rather than letting them build up in one place.
Please visit www.psychrosoft.com and try Psychrosoft software
ReplyDelete