14 Jan 2022

Part O, the new building regulation on overheating - a look under the bonnet

 Part O landed in our inboxes in December 2021, along with updates on Part F (ventilation) and Part L (energy efficiency). These standards will come into effect in England only in June 2022. Part O is new: it deals with the risk of summer overheating in new homes, a topic previously touched on, or rather skated over, in Part L. The risk is growing as summer heat waves become more commonplace, and as our predilection towards more glass seems to grow ever stronger, it's perhaps time to legislate the problem away, which is what Part O is attempting to do.

But has it succeeded? My first impressions are that the Department for Levelling Up, Housing and Communities has made an absolute pig's ear of the task and will be causing countless headaches for building designers and inspectors for years to come. It's not a lengthy document, coming in at just 16 pages before it starts the Appendices (15 pages). And maybe it's not lengthy enough, because it rests on some heroic assumptions and all-to-brief definitions of how we like to design, build and live in new homes. There is one example, discussed at the end of this blog, which identifies an unbuildable window because it can never pass both the required tests.

But first, the question must be asked as to what exactly Part O is trying to achieve. If it was just an end to the threat of summer overheating, it could have just told us to fit air conditioning into new homes. That's exactly what happens in lots of climate areas where sweltering summers are the norm. Air conditioning is also pretty much the norm in commercial buildings in the UK, which maybe explains why Part O is aimed solely at residential new builds. But air conditioning remains uncommon in homes, mostly because our climate is pretty mild and we are rarely troubled by summer heatwaves for more than a few days, and even these are pretty tame by global standards.

But if they are a concern, why not just make air conditioning mandatory and have done with, just like we do with space heating? The reason lies in the added energy used in air conditioning. The feeling is that if we can do without air conditioning we should, as it will save huge amounts of energy use in summer. All true but no one seems to have take on board that if we are to have enough zero carbon, non-fossil derived energy around to keep us warm in winter, then we will almost certainly have a huge surplus of the stuff in summer. Maybe we don't need to be saving energy in summer. This sort of conjecture is not addressed in Part O.

What Part O does look into is the so-called passive methods of preventing overheating. These are techniques and designs which minimise the threat of overheating and aim to raise the threshold above which mechanical cooling becomes essential. The simplest way of doing this is to have smaller windows, especially ones that face south and west, those which catch most of there sun's summer heat load. But there are many other ways. There are external shutters, awnings, brise soleil, low-g glass which restricts the amount of infra-red passing through glass, good ventilation systems, clever planting (vines, trellises), and more. The world of house design is full of ingenious methods of limiting solar gains. And Part O is aware of them all. 

However, if you want to take advantage of these clever design ideas, you will be forced to go down the route of undertaking a dynamic thermal modelling exercise, along the lines set out in CIBSE's TM59 model. This is a much lauded document that was published in 2017 and is something rather similar to the SAP assessments undertaken by specialists in order to work out the heat load of a new home. 

So far so good, if annoyingly expensive. These overheating studies will not come cheap. If you want lots of glass in your new home, then expect to have to go down this route.

But Part O presents us with an alternative route to compliance, using a simplified method that concentrates on just two aspects of this overheating problem, namely reducing glazing areas and increasing window opening sizes. Stop and digest this for a moment.

These two aims are contradictory. The first set of guidance tables, on page 6 of the document, are concerned with making windows smaller, in order to reduce unwanted solar gains, whilst the second set, on page 7, want windows, albeit opening ones, to be larger, to facilitate through ventilation. Do you foresee problems here? You'd be right. 

The principle concern of the first tables, 1.1 and 1.2 is to reduce solar gain by putting a lid on how much glazing a house or flat should be allowed to have. This is dependent on a number of factors.

    1. Whether the structure has cross-ventilation or not. Table 1.1 deals with situations where there is cross-ventilation; Table 1.2 deals with those without. Cross-ventilation is defined as the ability to ventilate using openings on opposite facades of a dwelling. It adds that having openings on facades that are not opposite is not considered cross-ventilation, e.g. in a corner flat. That's it. It sort of makes sense but it also leaves many questions unanswered. What about using an opening rooflight for ventilation? Or having opposite openings on different floors? Or in opposite facades but separated by doors? You can see that the reality is rather more complex than this flimsy definition suggests, and that common sense doesn't seem to play a part here.

    2. Whether the dwelling is in a high-risk location or a moderate one: there don't appear to be any low-risk ones. High risk is defined in Appendix C and includes most of inner London and central Manchester, defined by postcodes. Everywhere else is deemed to be moderate-risk. Quite why central Manchester is deemed to be high risk but central Birmingham moderate-risk is not explained, but let's not get bogged down here.  

    3. The next thing to decide is which way does the "largest glazed facade" face. The choices are North, East, South or West. What exactly is the largest glazed facade? Indeed, what exactly is the definition of a facade? Does it include roofs? What about buildings that are T-shaped or stepped? Where does a facade begin and end? None of this is explained. And what about if your large glazed facade is facing North-East? Do you average the difference? No guidance is given on this.
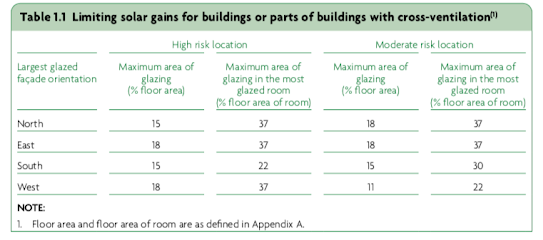

So having established all this, or not, you then get to look up the numbers in the tables which indicate how large you glazed areas can be. They numbers are ratios, all related to the internal floor area. The first column shows the proportion of glazing you can have in the house or flat as a whole, relative to the internal floor area of the house or flat. So if you have a flat of 80m2 and your largest glazed facade is said to face north, then you can have 15% of 80m2 (which is 12m2) of glazing throughout the flat. How or where this glazing is distributed on the various facades is not addressed, although by definition the largest amount must be on the North side. Move to the next row, East,  and you find that you will be allowed to have 18% of your wall areas glazed. 15% if it's North, 18% if it's East.

Now just why you should be allowed more glazing if your largest glazed facade faces East isn't explained, nor does it seem logical as North facing glazing will receive little of no solar gain because the sun never shines directly through it. You would expect the South facing facade to be the most vulnerable to summer heat gain, but its ratio is set at the same as the north. If you are being polite, you would say this is counter-intuitive. The alternative explanation is that someone has made a mistake.

Table 1.2, for buildings without cross-ventilation, is no better. Study the figures a little and see they are quite illogical. Perhaps the most striking error is that in the case of West-facing facades, there are more exacting standards placed on the moderate-risk locations than the high risk. 

The more you stare at these figures, the more questions pop up. It may be coincidental but there are only four values listed here on Table 1.2 (26, 18, 15 and 11) spread across 16 cells in the table. Something feels fishy....

There is also no guidance on roof lights or skylights, let alone glazed ceiling panels, increasingly seen in modern home design. Are these part of any facade and, if so, which one? And is their use to be included in the overall floor area: glazing ratio? Nothing you might do to minimise the risk of solar gain, such as brise soleil or shutters is taken into account. Neither is the quality of the glazing. It's also down to size and distribution of the glazed areas.

We then move onto the Maximum Area of Glazing in the Most Glazed Room. You can see what they are driving at here, but once again the guidance makes very little sense. Again they are using a floor area: glazed area ratio. The floor area of the most glazed room might seem easy to work out but here is a rider they have added in Appendix A. To quote, "where the room serves more than one activity e.g open plan kitchen and living room, the area with the largest glazing area should be assessed and the room calculated based on a room depth no greater than 4.5m from the glazed facade." At a stroke they have reduced, probably halved, the size of the room, thus altering the key ratio calculation. 

The maximum allowable glazed area vary from 37% of the floor area down to 22%. That means for a room floor area of 20m2, you could have 7m2 of glazed area in the most lenient orientations, down to 4m2 in the most taxing. That's actually quite a lot of glazing. But what is intriguing and wholly unexpected is that, if you have a Westerly glazed facade, you can have far more glazing in the high-risk locations than you can in the moderate-risk. And in the moderate-risk location, they are happier for you to have more glazing in the South facing facade than you can have if you face West. Really?


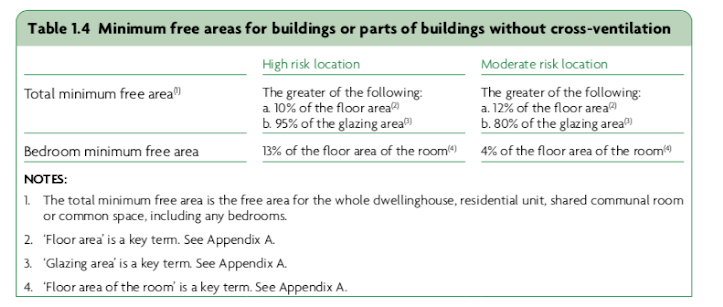
The second pair of tables in Part O, 1.3 and 1.4 (pictured), deal with expelling excess heat from the building by way of opening windows, sometimes called purging. 1.3 deals with houses or flats with cross ventilation, 1.4 deals with those without. 

Now purge ventilation has long featured in another building regulation, Part F, which as has been noted was also updated an published in December 2021. But Part F's purging is a rather different animal to Part O's. Part F is all about getting rid of nasty smells, smoke and pollution, whereas Part O seeks to dissipate excess heat. Part F requires that ever habitable room has a window somewhere that can be opened (even if its in an adjoining space) or at least ventilated like a bathroom or loo. It is really only interested in intermittent purging. Part O on the other hand is aimed at overnight heat purging, the sort of thing that is common in warmer climates where shutters are used to let the cool night air blow through the houses and flats. Rather like the two tables which deal with excess solar gain, Tables 1.3 and 1.4 concern themselves with setting minimum limits on window openings. Once again we have to look up definitions to work out what the hell its all about. One critical terms is the Total minimum free area. This is all to do with the size of the window and how far it opens. In fact there are a series of supplementary tables in Appendix D which show the calculations of free areas in window openings at various degrees of opening.

It transpires that what they want here are minimum openings, expressed as either a ratio to the floor area or the overall glazing area. They could make things far easier and say that a room of 5m2 needs an opening of 0.3m2, and a room of 10m2 needs 0.6m2. That would be much easier to comprehend. But instead they offer options. The minimum free area (i.e. opening) should be (in moderate locations with cross ventilation) 9% of the floor area or 55% of the glazing area, whichever is the greater. It seems to refer to the whole house openings:floor area ratio, but following on from the main calculation there is a supplementary ratio which applies to bedrooms. Bedrooms are the place where night-time heat purging is the most critical. Here it asks for 13% opening area:room size in high risk locations and just 4% opening area: room size in moderate areas. As moderate risk locations are required to have 9% openings:floor area, it seems likely that the whole house calculation will override the individual bedroom one.

The question of cross-ventilation is also here, and it is why there are two tables. A house or flat without cross ventilation gets a much higher standard to meet with up to 80% of the glazing area being classed as openable. That will be nearly every window and each will have to be openable to 90°.

This of course causes other issues, which also get detailed in Part O. Open windows are all very well, but some people live in noisy neighbourhoods, or have fumes they want to keep out. There are security issues and safety issues, especially where there are small children. There are also summer rainstorms to consider, not to mention insects flying in - who wants to be woken by a mosquito? You can see that whilst in theory wide open windows may be enough to dispel unwanted overnight heat, in practice the windows may not get used this way.

The underlying logic of these tables is that the first set of tables want you to reduce the amount of glazing you use to limit solar gains, whilst the second pair of tables want you to increase window size so that open windows can be used to purge unwanted heat. And this is where the problems with Part O's simplified method get tasty. 

I have discovered one great example. Take a West-facing room of 10m2 floor area in a moderate-risk area without cross-ventilation. Table 1.2 governs its window glazing size: it states that the glazed area in this room should be no more than 11% of the floor area. So that's (10m2 x 11%) 1.1m2. 

Then move onto Table 1.4 which governs the window opening sizes required for purging the heat away. The guidance is that the open area should be either 12% of the floor area (1.2m2) or 80% of the glazing area (0.96m2), whichever figure is the greater. That's 1.2m2 then. 

So using this guidance the maximum size of your glazing to satisfy the first test is 1.1m2, whilst the minimum size to satisfy the second test is 1.2m2 of open glazing. Just how you can get 1.2m2 of glazed openings in a window that has only 1.1m2 of glazing isn't explained.

In short, it's nonsense. Any chance of sending this guidance back for a rethink before it becomes mandatory in June 2022?


15 Mar 2021

How does a battery work?

Our mastery of electricity is one of the defining achievements of humanity and yet few of us have more than a very basic understanding of what electricity is. Here I look at one crucial aspect of our relationship with electricity: the battery. 

Electricity is one of the fundamental forces which bind the universe: these days it's combined with magnetism to form one force, electromagnetism, and one of the key guiding principles of this force is the attraction of opposites. Put two magnets side by side and they will push each other away, as if by magic. But put a magnet next to iron or steel and it will stick to it like a limpet. Similarly, electricity works by having positives and negatives. 


This reflects what happens down at sub-atomic level where the elements that make up atoms exhibit small electrical charges. Protons at the centre are said to be positive, whilst electrons fizzing around the outer parts of the atom are said to be negative. These opposites attract each other and most atoms stay in a nice, stable balance with an equal number of protons and electrons. However, not all electrons are stable and some can easily be pulled away to other types of atom. Electricty's main job is to hold atoms together yet, until around 220 years ago, all we saw of it was the occasional lightning bolt. 


But many proton-electron relationships are far from stable and that is the reason why atoms don't stay single but go out and form bonds with other kinds of atoms. Electrons have a habit of breaking away from the mother protons and finding another home.


Every element is defined by the number of protons and electrons it is made up of. I am deliberately ignoring the mysterious neutron here, which clusters around the core next to the proton, but isn't subject to this electric tension between protons and electrons. Hydrogen atoms have one proton balanced with one electron, helium two of each, lithium three and so on as you work your way up the periodic table. 


As the proton/electron numbers increase, we get into the world of metals like copper, iron and zinc, and we start to find that the bond between protons and electrons begins to get a little more exotic. Copper’s atomic number is 29, but one of its outer electrons (the so-called valent electron) can easily be persuaded to leave the orbit of the mother proton and head off someplace more attractive. If you can create a really attractive destination for these loosely aligned electrons, you are halfway to building a battery. Get the conditions just right and you can create a flow of electrons one way and a counter-flow of newly configured atoms, known as ions, the other way to balance out the matter. Chemists refer to this as a redox reaction.


It's all about balancing these charges. As the negatively charge electron leaves its home (the anode), what's left behind is an atom minus an electron. A copper atom is no longer electrically neutral, it's now positive because its now got 29 protons and only 28 electrons. Conversely, the atom where the electron has gone to (the cathode) now becomes a negatively charged ion, because it's gained a negatively charged electron. These two new ions (the anode and the cathode) now become attracted to each other and want to form a bond, a new compound material. The key to batteries working is to seat the anode and the cathode in a salt bath known as an electrolyte, which enables the newly charged ions to move into and meet. 


In a closed state — i.e a battery at rest — the electrolyte is configured in such a way to stop a redox reaction taking place as the anode and cathode are kept apart and the pull to swap electrons isn't strong enough. But fix a good conductor like a copper wire between the anode and cathode and the valent electrons in the anode start queuing up to escape the mother atom and head off to the delights of what the cathode has to offer. And as this happens, the electrolyte itself now become a pathway for the newly configured ions to meet up in. 


The two materials chosen to be the anode and the cathode have to be carefully chosen. There are lots of metals out there which exhibit what is called electrical potential (or voltage), so that in the right configuration electrons will flow from one to the other. And there are lots of materials which can be used to make up the electrolyte. Batteries have come a long way since Alessandro Volta demonstrated the world's first battery in 1800, and the development of batteries continues to grow apace. One of the most remarkable developments is the discovery/invention of the rechargeable battery which reverses the redox reaction by putting an external electric current through the battery. 


But all electric batteries have the same three common features. Two electrodes:  the anode (always given the - sign)which gives up its electrons and the cathode (or + sign) which receives them, plus an electrolyte substance which sits between them and acts to both stop reaction happening when the battery is off and enables the exchange of ions when the battery terminals are connected. 


You want a metaphor? Here’s a one for you, based around teenagers heading out for the local Wetherspoons. Home is safe but boring. They seek excitement and the lure of meeting friends and cheap drinks is the voltage required to get the interaction going. Off they head, along the copper wire, paying a bus fare to get there. Wetherspons is empty but stacked with cheap booze. There is a significant electrical potential between these two locations. The teenagers will only flow one way (until closing time, when the process can be reversed – that’s the beauty of the rechargeable battery).  


There is a parallel reaction that goes on simultaneously. The atoms left behind by the deserting electrons are no longer electrically neutral: they are anxious parents worried about the loss of their children. Similarly, the manager at Wetherspoons, having been more than willing to take the teenagers off the parent's hands, starts to get worried about the responsibility of looking after them. The more teenagers turn up, the more worried the manager gets. Both the parents and the Wetherspoon managers have ceased to be normal and stable and start behaving like ions, keen to make contact with the other party to find out if everything is OK. The teenagers meanwhile are oblivious to all this anxiety and are busy getting rat-arsed.


The metaphor breaks down here, because if what happens in a battery was reflected in a teenager's Friday night out, the anxious parents would end up coming into town themselves in their own cars (through the electrolyte) and would meet up with the Wetherspoons staff outside the pub, together with their children, and they would all choose to live together happily ever after in the streets somewhere between home and the pub. I don't think that's what happens in real life, but it does in a battery. 


However, the rechargeable battery is a different story. In this instance, everyone goes back to where they were when they started. The children go home, the pub is restocked with booze and another day dawns, ready for a re-run. 


14 Nov 2020

Are heat pumps the way forward?

There is a lot of talk about heat pumps. Some tout them as the future of home heating, a surefire way of combatting our carbon intensive heat habit. There's no doubt it's a big problem, as this diagram clearly shows, but are heat pumps an easy fix?


First things first. What exactly is a heat pump? The clue is in the name. Heat pump. Unlike every other form of heating we have ever used, a heat pump doesn't actually produce heat, it shifts it. It takes the heat out of a large body of stuff (be it the air around us, the ground underneath us or some body of water nearby), and shifts this heat into a much smaller body of stuff, either air or water inside the house. 

That is the magic of the heat pump. 


Another way of looking at this is through the medium of colour. Imagine you had a large square drawn on a sheet of white paper and that this large square is filled evenly with very pale pink colour. It took just three drops of red inkwash to get that pale pink colour. Next to the large square is a small empty square, about a third of the size. If we were to somehow suck the red inkwash out of the large square and pour it into the small square, the three drops of red inkwash would be enough to turn the small square bright red, whilst the large square would now appear to be empty. We haven’t made any new red inkwash, we have simply moved it from one square to another, whilst increasing its concentration. The pale pink colour in the large square is gradually replenished by more red ink wash (incoming solar radiation): in this way, heat pumps are (mostly) a renewable technology.


Heat pumps are not new. They have been around almost as long as electricity has been wired into peoples’ homes. And heat pumps don’t just make small spaces hotter: the heat can flow the other way, in order to make spaces colder. Think of the domestic refrigerator. Every home you have ever lived in already has a heat pump working away in the background, at the back of the fridge. The same technology underlies the world of air conditioning as well. It’s a huge worldwide industry. 


But what concerns us here is the home heating aspect of it. It’s a technology that has energy-efficiency burned into it and, used well, it can achieve enormous energy savings with the potential to make the switch to electric heat a lot more palatable.


The key point of interest to engineers here is to measure the level of energy efficiency. This is conventionally expressed as the ratio of the amount of heat being pumped into a house set against the amount of electric energy required to run the heat pump. 


This ratio (heat in:power used) is known as the Coefficient of Performance or COP, and when you start getting versed in the world of heat pumps you will hear the term COP (or sometimes SCOP, where the S stands for Seasonal) used a lot. The higher the COP the better; it means the heat pump is more efficient and this makes it both cheap and green to run. 


The downsides for heat pumps is that they are relatively expensive to install and that they are electrically powered. Whilst electricity is now less carbon intensive than gas, and appears to be on course to become nearly carbon-free over the coming decades, domestic supply is currently three to four times the cost of gas.


If you want British consumers to switch over from gas boilers to heat pumps, you really need the heat pump to be at least three to four times more efficient in order to cancel out the pain of higher fuel bills. So if you manage to get a COP of 3 or 4 (which is technically quite possible), then your new electricity fuel bills will be comparable with your old gas bills. Get your COP higher than 4 (unlikely, but it has been known) and you will have the most thrifty heating system imaginable. Not only greener, but cheaper to run.


So why not just buy a heat pump with a very high COP? This is where it starts to get complicated. Unlike a gas boiler, which simply responds to a command to “Burn, baby, burn”, the actual performance of a heat pump is down to what you demand from it. Ask it to lift the internal water temperature by 30°C, and it will turn in a five-star performance with a COP way over 3. However, ask it to lift the water temperature by 60°C, and it will be a very different story. The same heat pump will be performing with a much lower COP and the cost of your home heating will appear to be astronomical. In fact, for every 1°C temperature increase you ask from your heat pump, the COP falls by 3%. The lab tests used to advertise the relative performance of heat pumps are all conducted at low temperature lifts.


So how much work will you require from your heat pump? 30°C lift (success) or 60°C lift (failure)?


There are some big variables to consider here.  Let’s look at the two most important.

The input temperature

The warmer the heat source, the less work the heat pump has to do, and therefore the more efficiently it runs. Not all heat pumps are the same. Air-source heat pumps (ASHP), as their name suggests, draw their heat from the surrounding air and they therefore have to deal with a very wide temperature range. In summer, they can be immensely efficient but homes don’t need space heating in summer. In mid-winter, when the air temperature falls below zero, they are starting with one arm tied behind their back and their efficiency (COP) falls substantially. In contrast, ground source heat pumps (GSHP) draw their heat from below ground where temperatures are much more even throughout the year. It follows that, over the course of a year, GSHPs are more efficient than ASHPs. The downside is that GSHPs are much more complicated and expensive to install.

The output temperature


The two key factors affecting your heating demand are space heating and domestic hot water. Space heating is conventionally delivered via radiators, or occasionally underfloor heating. The water flow temperature in your radiators can be as high as 70°C, which is enough to put a huge strain on any heat pump. The solution may lie in fitting bigger radiators capable of working at lower temperatures. Underfloor heating is designed to work at around 40°C  and therefore makes a good partner for heat pumps, but unfortunately very few homes in the UK have underfloor heating systems. 


Domestic hot water is another kettle of fish. Most UK homes, at least most small ones, now use a combination boiler (aka a combi) to supply their heating needs. A combi heats hot water instantly with a quick blast of gas. Heat pumps are unable to do this: they work by supplying a steady trickle of heat, so hot water for the tap or shower has to be sourced from a storage tank such as a cylinder.  


This is a problem for many homeowners in that combi-heated homes don’t have any hot water storage, nor do many of them even have space for hot water storage. If you are very desperate, you can probably find a place somewhere in your home for a hot water tank, but it will involve lots of plumbing and probably carpentry as well, to create an airing cupboard. 


If you are building a new home, these issues won’t be a problem. Hot water tanks, underfloor heating, good insulation, efficient glazing: all these things are easy to build in. But if we wish to make our existing housing stock all electric, we have some major issues to address here if we want to switch over to heat pumps. We have developed a housing stock that is based largely on high-temperature, gas-fired instant heating. Weaning us off this will not be easy.


Good installers know all this and will be able to advise you as to whether your home is heat pump ready or even heat pump compatible. Cowboys will just sell you a heat pump and let you suffer the consequences - cold homes with high fuel bills.

Hybrids

If you don’t have a heat pump ready home, and you are not inclined to undertake the upgrades required to do this, there are hybrid options available. Typically this might be keeping your gas boiler and using it for domestic hot water and for very cold days in winter when a heat pump will struggle, but using a heat pump for the main bulk of your space heating requirements. As space heating typically makes up something like 80% of your homes overall heating bill, such a solution will make quite a difference to your carbon footprint, but it’s unlikely to be any cheaper to run. Hybrid solutions can also be combined with solar thermal or PV which will further reduce your carbon footprint. But you won’t be on course for a fully electric home whilst you still have a fossil fuel boiler as a back up.


If you want to do that, you can always fit an electric boiler. They even make electric combis, but they are underpowered when compared to their gas-fired cousins. And of course, they will cost three to four times as much to run. Not really a very enticing option.


Policy

The government is indicating that it wants us to switch to heat pumps for all new homes within a few years. Technically this should be no problem, as new homes can be designed to be heat-pump ready. The problem resides in what we do with the existing housing stock, something like 25 million homes heated by gas or oil which won't take easily to a heat pump without a fair bit of adaptation. This is what needs to be the focus of policy over the coming years. The switch over to heat pumps isn't going to happen without a few carrots (incentives) and sticks (taxes on fossil fuels), and how these issues are approached by our government will be a measure of how serious they are about de-carbonised home heating. 


The only document they have published so far on this topic, the Future Homes Standard, is a very tepid dish indeed, which will have very little impact on the rate of heat pump deployment in the retrofit sector.


21 Apr 2020

On waste and recycling

I’ve always felt that it is a good idea to have a waste strategy for every home I have lived in. Something just a bit more sophisticated than sticking everything in the bin, which is what used to happen. Over the years, it is something which we as a country have been encouraged to do as well. Whereas when I was a child there was one bin, now there are at least three and we are expected to sort the waste we produce into the correct bins.

The first UK bottle bank was opened in 1977 (in Barnsley, naturally). Things started slowly but got moving on a national level in the 1990s. Then, in 2003. the Household Waste Recycling Act was passed. It required every local authority in England to provide each household with a separate collection of at least two types of recycled material by 2010. The age of the wheelie bin was well and truly with us and it seemed like we were entering a phase where the country would stop dumping everything in landfill and start to get to grips with all the waste we generated.

But looking at it now, it seems that perhaps our hopes were misplaced. It turns out an awful lot of our waste was simply being loaded onto vast container ships and sent to China where they did heaven knows what with it. In 2018, China said enough is enough since when we have finally had to confront the fact that, though we collect all this waste, we don’t really have much idea what to do with it. For whilst local authorities are mandated to collect different waste streams, they are free to decide what goes into which stream and they are under no obligation to see that any of it actually gets recycled.

So confusion reigns. Each local authority has its own rules and the rules themselves are often most unclear. Take the vexed example of plastic packaging: we are swimming in the stuff. But it turns out that some of it is recyclable whilst other stuff isn’t. So which is it? As you stand over your kitchen bins with some plastic packaging in hand, do you put it into the black bin for landfill or the blue bin for recycling? Or perhaps your bins are a different colour — they couldn’t even decide on that.

If you are like me, you hesitate then hazard a guess. I sometimes even refer to the council website to see what goes where. But too often I draw a complete blank as the thing I am trying to dispose of isn’t mentioned. Wheareas once upon a time I used to pride myself of recycling almost everything and hardly ever having to put something in the landfill bin, I now realise I was being hopelessly optimistic. 

Recycling itself is run as a market operation. If there is a market for the material you throw away, it can be separated, bundled up and sent of for reuse. All well and good. That’s what you hope will happen. But if the market price drops below what it costs to do the recycling, then what used to get sent to China now ends up back in landfill or in the incinerator, which is where the problem started.

Have we really spent 30 years deluding ourselves about recycling? In that time it’s become the mark of a good citizen that you take your recycling seriously, trying to send very little to landfill. But for all the effort we’ve made in our kitchens and bin stores, it appears that what actually gets recycled is pretty minimal, and it’s not even increasing. The recycling bin labelled "The Chinese will sort it out" has been closed for good.


8 Mar 2020

Wine bottles

I've drunk wine all my adult life. Just how much, I hate to think.  It's an infectious habit for sure, one which I share with probably half the UK population. It seems, from a trawl of the stats, that we consume something like 25 bottles each per annum. Seeing as half the population doesn't touch the stuff, that must be about a bottle a week for those of us that do.

But this blog post isn't about the wine we drink, but the way we drink it, which is almost always poured from glass bottles. Wine as a product is around 40% packaging by weight, which is incredibly wasteful, and would shame most other food and beverage suppliers into extinction.

A typical bottle of wine is 75cl by volume: the wine itself weighs about the same as water (i.e.750gms), the bottle anywhere between 500 and 600gms. And the great bulk of the wine we buy is bottled at source, which may well be on the other side of the world. Australia, New Zealand, Argentina, Chile, South Africa, California — we just love their wines. But what a waste it is to ship their wines in heavy glass bottles. Not that it's much better from nearer European vinyards — it is still a very strange way to organise a business based on the pleasure of drinking.

So why is wine placed into glass bottles? The short answer is that it is tradition. We consumers like to see a nice bottle with an attractive label, and to most of us the pleasure of drinking wine starts when we handle the bottle unopened in the shop. Ever wondered why there are just so many wine varieties in a supermarket? The idea here is that you are making a personal choice that says something about you, your wallet and your taste, something that can't be said for Diet Coke or any other soft drink.

The producers also like it because bottling at source gives them some protection over the content. As much as 37% (by volume) of the international wine trade is done in bulk shipping containers, to be eventually bottled in the country of consumption. But by value, that 37% volume reduces to just 11% in value, which shows you that bulk wines are really aimed at the bottom end of the market. Put another way, the average bottle of table wine enters the country of consumption at €2.84/bottle: with bulk wines, this figure per notional bottle reduces to just €0.60, a quarter as much.

Which begs the question, why don't quality producers think about BiB (Bag in a Box)? It's been available as a method of supplying wine for over 30 years but it only really covers the bottom end of the wine market, except in Sweden, where premium wines are widely available this way. There is nothing intrinsically difficult about pouring wine into bags, and it stores much longer than opened bottles. Only the very finest of wines, bought for their ageing potential, actually require a glass container: 99% of the wine market is designed to be drunk within a few weeks or months of purchase.

And the packaging? Instead of 500 to 600gms of glass per bottle, the equivalent weight in BiB is no more than 40gms,  a mix of cardboard outer and a plastic pouch. It makes sense both economically and environmentally, as currently the world's shipping lanes carry something like 9 billion bottles of wine each year.

The question which of course will bother wine drinkers is whether there are BiB wines on the market that are any good. I'm no expert in this. Maybe I can report back at a future date when I have sampled a few. But to get me started, I have ordered a red and a white from the BiB Wine Company and so far I have been impressed. At £10-£12/bottle equivalent, their offerings are bang in the middle of my price range sweet spot.

To learn more about the international wine trade, I found this site. And calculating the environmental impact, I found this site most helpful.

12 Feb 2020

The risks we face

Back in November 2019, I blogged about plate tectonics and, in particular, how we live - and die -with the earthquakes, tsunamis and volcanoes that result from us living on an unstable planetary surface. It set me thinking more about the more general risks we face and how we can categorise them.

Plate tectonics covers the below-ground risk. But what about things dropping on our heads from outer space? These could be solid, like meteorites or asteroids, but they could also be unwelcome rays from the Sun or elsewhere. We don't see much evidence of these risks but they do happen and very occasionally they can be very deadly. A single huge collision with another heavenly body 65 billion years ago is believed to have been  responsible for the extinction of the dinosaurs.

The third field of risk is atmospheric. The Earth's surface is surrounded by a relatively thin layer of gases which we depend on for life. As the Earth both rotates and tilts on its access, the resulting winds and weather patterns cause all manner of mayhem at the surface. Think Droughts. Storms and Hurricanes. Monsoons. Flooding. Extreme temperatures. Fog. Snow. Ice. Fires (albeit at one stage removed but remember that oxygen is an essential component of fire).

The atmosphere also dictates which life forms, if any, will occupy the surface. No rain = dessert. Frozen rain = snow = Arctic like conditions and glaciers. Lots of heat and rain = jungles. Lots of rain and coolish temperatures = Manchester.

We interact with our atmosphere in ways we don't with the ground beneath or space above. For instance, we can turn fog into smog by adding burnt carbon to the atmosphere. And we can alter the characteristics of the atmosphere itself by tinkering with its component gases. In particular, with carbon dioxide which, despite being only a trace gas making up just 0.04% of the Earth's atmosphere, is known to act as a thermostat for global temperatures.

A more nuanced example of this was our production of CFCs, a 20th century phenomenon, which then drifted into the upper atmosphere and reacted with ozone. This resulted in large holes in the ozone layer which acted as a dampening layer for incoming solar radiation. This made sunshine a far more dangerous factor for those outdoors and led to increases in skin cancer. The Montreal Protocol, in 1987, was a fine example of nations working together to ban the use of CFCs and to bring about a gradual repair of the ozone layer.

An even more nuanced example would be the current fear about the spread of the cornonavirus from China. The atmosphere carries with it not just the threat of challenging external weather conditions, but also as a carrier of communicable diseases.

So there you have it. We live on a Planet with an unstable surface, subject to bombardment by things from outer space and dependent on a thin zone of gases which behave in a somewhat chaotic manner, and which we have started to use as a waste dump.

Having said that, it's a beautiful morning here in Cambridge and it's good to sometimes feel that Earth is not such a bad place to be posited on for a while.


1 Feb 2020

Carbon-free electricity

The race is on to produce zero carbon electricity, which is the most straightforward way of slowing/stopping climate change. But how realistic is this goal, and how long will it take? Here's a summary of the situation in the UK.

When we say 'zero carbon electricity' we are referring to how electricity is made, not what's in it. Using fossil fuels to make electricity (the traditional method, if you like) burns lots of carbon which releases loads of carbon dioxide (CO2) into the atmosphere. Renewable technologies, hydro power and nuclear power produce electricity without burning any carbon and are therefore said to be zero carbon. The electricity we now use is from a mix of sources and therefore can be said to have a carbon intensity factor, depending on how much is derived from fossil fuels (carbon) and how much from zero carbon sources. The higher the proportion from fossil fuels, the greater the carbon intensity is said to be.

The standard measurement (or metric) used to express the carbon intensity of electricity is grams of CO2 equivalent per kWh (kilowatt hour) of power, written XXXgCO2ee/kWh. The word "equivalent" is in here because other climate changing gases (notably methane) are also released during the production processes and these have to be taken into account when considering the global warming effect of the different gases. It's a complex field and the maths is not quite as straighforward as we might hope for. Methane has a large global warming footprint, but only stays in the atmosphere for a few years, unlike CO2 which hangs around for centuries before slowly being absorbed by the oceans.

When we first started making electricity on a commercial scale, the preferred method of production was to use coal-fired power stations to drive huge turbines. Coal-fired electricity has a very high carbon intensity factor, as it releases masses of CO2: anywhere from 750 to 1,000g/kWh, depending on the type of coal and the efficiency of the plant. Coal also happens to be a dirty, toxic fuel which poisons a lot of people, but that is not what concerns us here. Using gas to make electricity is a much better option than coal (and it's cleaner) but it still produces a lot of CO2 —  it scores between 380 and 480g CO2ee/kWh/kWh.

In contrast, with the notable exception of biomass, all the non-fossil fuel production methods are zero-carbon. That doesn't mean there aren't other issues surrounding their use: nuclear power maybe zero-carbon but it is not zero-problem (Chernobyl, Fukashima etc). But from a carbon intensity point of view, they all score zero. Or 0g CO2ee/kWh. To be pedantic, there are carbon costs with renewables but they are solely to do with the construction or manufacture of the equipment — known as embodied carbon.

The carbon intensity of fuel table can be summarised thus (all in g CO2ee/kWh):
Lignite: 850 - 1100
Coal: 750 - 1000
Oil: 550 - 700
Natural gas: 380 - 480
Biomass: 50 upwards
Nuclear: 0
Wind, solar: 0
Hydroelectric: 0

More details via Google or Wikipedia but a good source is here.


The history of UK electricity production shows the carbon intensity was high, at around 700g CO2ee/kWh in the 1970s when it was almost all produced by coal-fired power stations. As the switch to gas took place over the following decades, the intensity falls to around 450g CO2ee/kWh. Here is a useful summary of the situation up till 2015.  However, since 2015, the rate of change has accelerated dramatically, as you can follow here. The principle reason for this is the switch to offshore wind farms, which have had a massive effect. Maybe because it is happening out at sea, we are only barely aware of this major infrastructural change. Other factors include decreasing demand for electricity overall (which makes it easier to drop coal from the energy sources), an uptake in solar PV and a switch from coal to biomass as the huge Drax power station in Yorkshire which alone accounts for around 8% of the UK electricity demand. Currently UK electricity averages around 230g CO2ee/kWh


What it means is that electricity has gone from being a much higher carbon intensity than gas to becoming much the lowest carbon intensity power source, all in the past five years. And it is due to head lower still over the next 15 years, as we move to decarbonise the grid. Electricity is, however, over three times the price of natural gas, so a switch to electric heating is still unlikely any time soon, especially as the cost of heat pumps, the obvious technology to employ here is way more than a standard gas boiler.

I for one hadn't realised quite how quickly this change would take place and as a result fitted a gas condensing boiler in our new home - a decision made in 2017 - on the basis that we had done everything possible to minimise the heat load and that, as electricity released rather more CO than gas, it made sense to go with the cheaper power source.

The government has recently published the Future Homes Standard which is a mixed bag of proposals outlining measures to decarbonise our housing over the coming decade. It's received a very lukewarm review from almost every commentator, but the headline move contained in the proposals is that ‘new homes should not be connected to the gas grid from 2025’. 


Given the huge change in the mix of energy sources we are using to make electricity, this single proposal will rank as the most significant decarbonising measure we have ever taken.

25 Nov 2019

On the Tragedy of the Commons

The theory known as the Tragedy of the Commons was first postulated by British economist William Forster Lloyd in 1833, but it was popularised by the American philosopher Garrett Hardin in 1968 in an article in Science Magazine. It is now widely used in the field of environmental studies.

So what is it?

Imagine an area of common grazing land. By common, I mean it is owned by everyone, rather than by an individual. Such common areas have been a feature of European culture since mediaeval days. Now, the population at large enjoy grazing rights and are free to let their cattle graze on the grass growing on the common. Furthermore, it’s a good use of the grass because otherwise it would have to be cut by machines and taken off-site for hay storage. 

Over the years, more and more people take advantage of their grazing rights on our imaginary common and the number of cattle put out to graze there grows steadily. Then one summer, there are just too many cattle grazing and all the grass is eaten long before the winter comes. The common land turns to mud and the cattle starve. The land has been overgrazed. What a tragedy we have cooked up here – we've been undone by our own greed! 

Well, technically speaking, this is not a tragedy at all, it’s a balls up, but let’s not get too Shakesperian about this. It’s known as the Tragedy of the Commons and the name has stuck.

So what to do about it? The basic question is to first work out what the sustainable level of cattle grazing is for our common. Say, for argument's sake, it is 25. 25 cattle on the common in the summer and everything stays hunky dory. But put 26 on it and, pretty soon, the grass can't keep up with all those hungry cattle. So a logical approach here would be to limit the grazing rights to 25 cattle. This is where it gets tricky.

Who decides which 25 cattle get to graze the common?  You could do it by drawing lots, but what then would the unlucky losers do with their cattle? Sell them on? Or hold out for a better draw next year? 

Alternatively, you could sell grazing rights to the highest bidders – but then it has stopped being common land. Or maybe you could subdivide the common into 25 plots and sell the land. Then it’s called enclosure and you have really moved way away from the common ground idea. 

By and large, when it comes to land ownership, we have as a planet moved away from common grazing rights towards private ownership as a solution to this conundrum. You could sort of see the history of agriculture as being mostly about enclosing common land. The fence is the enemy of the common. But there are lots of assets (the oceans? the atmosphere?) which can’t be divided up like this and where we have to work out a common destiny in order not to queer the asset. 

It’s not hard to see how this question plays out in a world of many billions of people. It is just possible that our planet can cope very comfortably with, say, 3 billion people living a Western lifestyle enjoying full bellies, good housing, social security, pensions and foreign holidays, but that at 10 billion the grass will stop growing and we will all fall out of bed with a bump. Yes of course it's possible. It is quite likely even. But how would we know where the sustainable boundary is? It is not as though we will find out in the course of one summer's grazing.

We move here into the subject of planetary boundaries which explores just where our limits may lie. The most sophisticated model for this hails from Sweden. Planetary Boundaries: the Stockholm Resilience Centre.  

They suggest there are 9 boundaries of which climate change is but one. But, as with the cattle on the common, it is one thing to identify just how much developmental pressure our planet can take, quite another to decide how to implement best practice. It is horribly compromised by us having divided the world up into a series of nations who jealously guard their own boundaries. Some countries (Russia, Canada) are well equipped to deal with planetary changes and resource depletion. Rather more countries are poor, have high populations and are very vulnerable to shifting climates.

Environmentalists like the metaphor of the Tragedy of the Commons because it sticks it to the neoliberals. It's a great example of market failure and it cannot be sorted out without some form of political intervention. The planetary boundaries are real enough and the technical solutions are understood. But what actually happens is all down to politics. And international co-operation-type politics, something we are very poor at.


19 Nov 2019

On Plate Tectonics

The theory of plate tectonics is much more recent than our understanding of climate change. It was first postulated by Alfred Wegener in 1912, and what he talked about came to be known as continental drift. I can still remember learning about this phenomenon at school in the 1960s. Around that time other researchers took Wegener's hypothesis and ran with it so that soon theories started appearing about just how vast Continents could actually move around on top of the Earth’s crust.

Plate Tectonics postulates that there are nine major plates and many little ones and that they are essentially floating around, bumping into each other, and over many millions of years, they are shifting quite long distances around the planet's surface. For instance, the largest plate, made up pretty much of the Pacific Ocean, is currently moving northwards at a rate of 7cm/annum. It seems incredible, but it has quickly become accepted as a scientific fact. In comparison, the basics of climate change theory was established in the 19th century and is in many ways far more readily understandable as it's all down to demonstrable physics.

Why are there no plate tectonic deniers? Good question, but the answer is very easy to spot. We have no part in its processes — other than suffering the consequences when the colliding plates periodically erupt. 

And what consequences do we suffer. This century has already witnessed two terrifying tsunamis: the 2004 Indonesia event killed 230,000 and the 2011 Japan tsunami killed 20,000, not to mention devastating Fukishima nuclear reactor. Besides these, we have also suffered 13 earthquakes with death tolls above 1,000– the worst ones being Haiti 2010 (300,000), China 2008 (87,000) and Pakistan 2005 (87,000). All since the year 2000: about a million deaths, all through people happening to be in the wrong place at the wrong time.

In contrast, the most severe storms rarely result in huge death tolls. Typically a really awful hurricane or typhoon may cause deaths in the low thousands, but nothing compared to the devastation caused by earthquakes. Unlike earthquakes and tsunamis, people know about storms before they arrive and take defensive action. Similarly with wildfires. They may look horrific, but most people are able to evade the flames. When there are death tolls, they are measured in the tens, not the tens of thousands.

Even if the number of typhoons and hurricanes and wildfires were to double in frequency and intensity over the coming decades, which most climate scientists predict, the resulting death tolls are unlikely to come close to the damage caused by our tectonic plates shifting. Other effects of climate change are more subtle and long lasting, mostly to do with weather patterns changing and people being forced to move to different regions because of droughts and desertification, but events like this rarely get into the headlines.

It is also worth bearing in mind that the death tolls from extreme events, whether climate-related or not, are as much a feature of the ability and wealth of the local population. The reason 300,000 people died in Haiti in 2010 was not because their earthquake was so much worse than others (it was a 7.0 event on the Richter scale, high but by no means exceptional), but because Haiti is so poor that the population weren't able to protect themselves either from the quake or the devastation left behind afterwards. 

That poor countries get knocked sideways by events which wealthy countries take in their stride is a truism that keeps cropping up. It is frequently used as an argument for re-distribution of wealth from rich countries to poor ones. This may be equitable and even desirable, but the way the political winds are blowing, it seems unlikely to happen any time soon.

This is the main reason that the climate change "debate" is so terribly charged. Whereas what plate tectonics throws at us is not in our control, climate change has our fingerprints all over it and so we have to take responsibility for the consequences. Let's rephrase that. We ought to take responsibility for it. To date, all we've really done it talk about it a lot and make a few tentative steps towards reducing our CO2 footprint.

Arguably, the two phenomena are not really quite so different. Whereas we cannot be held responsible for earthquakes and tsunamis, these events can be mitigated against through pre-planning and good building codes. And these are things you get right when there is wealth and good politics.

As an endnote, it is worth considering that globally over 1million people die each year in road accidents, and most of them are young and physically fit. If things carry on this way, that will be over 100 million deaths this century, a figure which far outweighs the likely death toll from plate tectonics. In all probability is also likely to be far higher than deaths arising from the effects of climate change. Road accident deaths are very much in our control. We could restrict car speeds to 20mph which would reduce road deaths by 90%, but we choose not to because we value speed so highly. Is there a parallel here with CO2 emissions? 


30 Jun 2019

Is the Eden Project a vision of our future?

In early June, I went to visit the Eden Project in Cornwall. It's been open since 2001, so you might wonder just why its taken me so long to get there, as I have been in Cornwall many times over these years. But it seems to me the Eden Project was built as a rainy-day visitor attraction and maybe I had been lucky with the weather up till now. But a wet June day finally saw me cross the threshold, buying tickets for our party of four at an eye watering price, and following the many other rain dodgers down into the gigantic tropical biodome which is its centre piece.

It's bloody hot and humid in there and after about an hour wandering around I was feeling quite exhausted. But also amazed by the sheer scale of the structure. I've been in hot humid glasshouses before — we have several in the Botanical Gardens in Cambridge — but the Eden Project biodome is the size of a large airport terminal. Our party was pleased to get out of it into the relative coolth of the adjacent Mediterranean dome, and even more pleased to get out into the open air half an hour later.

On the way home I started musing about whether the Eden Project has anything to teach us about the impending climate crisis. If we fail to keep the average temperature rise down to manageable levels, we will render much of the Earth's surface uninhabitable. Well much of it already is, let's be frank. But parts which are now readily inhabitable will become too unpleasant to forge a life in. But spaces like the Eden Project, provided they can get good supplies of energy, will continue to function even at very much higher temperatures, because we can create an indoor climate which will be very comfortable for human beings, and indeed, animals and plants.

In a sense these changes are already happening. We are tending to move into cities which are certainly non-natural environments. We already have homes which are already heated and cooled spaces, insulated form the outside environment, and we mostly travel in cars, buses and trains which have controlled environments. Cross what we already are doing with Eden Project type biodomes and you have a viable future landscape. It's a bit like what would happen if we were to colonise another planet where the air wasn't capable of supporting us. There we would have to build an artificial atmosphere around us, as indeed many science fiction writers have postulated. It's as if we were bringing our plans for the colonisation of Mars back down to Earth to tide us through this climate emergency.

The downside to this is that it is unlikely to support the 7 to 10 billion people reckoned to be living on earth by mid-century,  not to mention their feedstock animals and plants. These biomes would probably be constructed in places which would be relatively immune to the tempestuous weather we may experience, and on high ground to avoid rising sea levels. Probably away from earthquake and hurricane zones as well, so as to maximise their chances of long term stability.

The wild, untamed outside areas would probably consist of 99% of the Earth's land cover and we would be free to explore these areas, weather and climate permitting. But live there? Not really possible anymore. There might be vast areas used to collect solar and wind energy needed to keep us humans comfortable in our biodomes, or maybe we would have all gone nuclear by then, because no one will be too worried if there is a radiation spill as there will be no one living within 100 miles.

How many people would this sort of future support? I guess that depends on how many of these biodomes we managed to build. But say each biodome was around 10km2, a 3.5km diameter circle. A luxurious one might support as many as 100,000 people (having 10m2 each). That's just about feasible to comprehend. It would be like putting a roof over an entire town.

Of course you would immediately be cast into a world where there would be upmarket biodomes (maybe 25m2 each) and low rent ones (less than 10m2 each). And then there would be those who couldn't afford to live in a biodome and maybe they'd be left to fend for themselves in the wild parts of the planet. Or maybe not....

It would be very expensive to build biodomes of this scale, but what exactly would be the alternative?  The most obvious answer is to mitigate - to reduce our dependence on fossil fuels, and keep the whole planet's atmosphere in defined limits so that it is one big functioning biodome. But despite so many people's best wishes, at the moment this seems unlikely, as the political will required to do this is sorely lacking. Another option is to start tinkering with the planet's atmosphere and try and keep it within comfortable bounds. But at the moment, this also seems an unlikely prospect.

Life on Earth will continue, whatever we do to the climate. But just how much life, and under what conditions, is still a very open question.


18 Jun 2019

Housebuilders Bible 13

The text and images are ready to go on the next edition of my Housebuilder's Bible. Final proofing stage has been reached and the book is set to be printed in July for an August launch. This will be the 13th edition. The first edition one came out in December 1994, so the "project" (for that is what it is) is now in its 25th year. The book has sold just over 175,000 copies in that time which works out at a sale every 75 minutes.

I know it's been helpful to many because I've had a lot of feedback over the years, but it's position has changed because selfbuild, as an activity, has become far better known and there is so much more knowledge out there now. Not to mention the coming of the internet, which barely existed in 1994.

Still, the internet can be a lonely place, and there are many questions that it doesn't answer terribly well. Sales patter....it's full of it. Opinions....everywhere. But a simple question, like how best to build a house, really isn't addressed at all. I hope Edition 13 can shed some light on this. Whereas in 1994, my aim was simply to be a conduit for lots of useful information, today it's become a little more nuanced. Now it's more about trying to make sense of an overload of information out there.

8 Jan 2019

Plasterboard buying and waste tips

Up until 2005, there were no restrictions on dealing with plasterboard or gypsum waste from construction sites. In that year, the government (at the behest of an EU directive) began to treat plasterboard differently. Although it's not a hazardous material in its own right, it can react with biodegradable materials to create hydrogen sulphide (think rotten eggs) and it has been deemed to be best if plasterboard isn't just added to landfill where it might encounter just about anything.

But the regulations have never had much teeth and, unlike asbestos, waste companies have tended to turn a blind eye to the disposal of plasterboard and gypsum plasters generally. This is because builders themselves either don't know about the requirements for plasterboard disposal or, more likely, don't care. In fact, plaster products are recyclable and a good waste disposal business will do just that, so that very little plasterboard need ever end up in landfill. But a skip user has no idea what will happen to the skip after it leaves site. Plasterboard off cuts just get placed in the skip, or taken down to the tip.

In fact, my local skip company does offer a plasterboard-only skip collection service. The special skips cost around 15% more than regular skips, and in addition charge of £75 for each extra tonne above the first tonne placed in the skip. On the other hand, they readily accept plasterboard offcuts in ordinary skips as long as the plasterboard makes up no more than 20% of the waste. Who exactly is going to measure that?

Plasterboard buying is notoriously difficult to estimate correctly because it produces so many offcuts. It is usually better to slightly underestimate and then buy the additional requirements in small batches until the work is complete. What you want to avoid is having to dispose of 20 or 30 sheets of the stuff.

2 Jan 2019

Housebuilder's Bible 13

Today I start work on the next edition of the Housebuilder's Bible - No 13. I haven't used blogger since 2015 as my attentions moved on elsewhere and blogging seemed to fall from grace both for me and in general. But I am thinking it a great place to get back in the swing of writing short pieces, if only to hone my rusty writing skills. My aim is to contribute a few blogs about things I uncover in my research over the coming months. All comments and feedback welcome.


28 Sept 2015

Searching for Ronan Point

I spent the weekend working at the Homebuilding & Renovating show at London's Excel centre. By way of relaxation, I often walk the neighbourhoods surrounding these venues both before and after showtimes. Excel is situated next to the Royal Victoria Dock in the heart of London's East End and co-incidenatlly, very close to the site of Ronan Point, the ill-feted tower block which partially collapsed shortly after it was completed in 1968.


The story of Ronan Point has been well documented and there is much on the web about it all. Five people died after a resident attempted to light her gas stove early one morning and instead caused a gas explosion which blew out her kitchen wall and this caused all the kitchens above and below hers to collapse. Whilst the number of deaths was a tragedy for all concerned, this part of London had been well used to explosions having been witness to some of the most intense bombing in the Blitz, not to mention the largest explosion ever to be recorded in London at the Silvertown TNT plant in 1917.

The Ronan Point collapse is remembered now not for its death toll but for the way it marked a turning point in the history of housing in the UK. The 1950s and 60s were a time when Britain went a-housebuilding in a way that has never been seen before or since. Many of the big cities were still bomb damaged after WWII and what remained undamaged was in very poor condition and was widely regarded as little more than slum dwellings. So London's East End was being cleared of existing Victorian housing stock and grandiose schemes of cities in the sky were being enacted. Corbusier's dream of tower block living was coming to fruition here in Canning Town.

However, the dream and the reality turned out to be poles apart. By 1968, tower blocks were being thrown up in record time using pre-fabricated walling systems and, as it later transpired, very low build standards. Only when the boffins came to examine Ronan Point after the explosion did they realise just how poorly these blocks were built, and that it was surprising that more didn't suffer a collapse similar to Ronan Point. Part A of the building regs was in large part re-written because of what was learned from Ronan Point.

The disaster marked a turning point in the story of the slum clearance policies and council house replacements, as well as sounding the death knell for council tower blocks. The dream died with the collapse of Ronan Point. The enthusiasm and vision of a brave new world, built high in the sky, was quietly abandoned with the realisation that this was no way to house people. When the entire Freemasons Estate (9 identical tower blocks of which Ronan Point was one) was eventually demolished in the 1980's, it was pointedly replaced by low rise terraced housing, built by Barratts.

Only now, in the 2010s, has tower block building returned to fashion. The Docklands Light Railway which cuts through this area is now a great vantage point from which to witness the return of high rise flats in this part of London. Let's hope it ends rather better this time than it did in Canning Town in 1968.

I was intrigued to see what evidence of Ronan Point there is today so I went exploring along Butchers Road, E16, to see if there is any indication what happened there one May morning nearly 50 years ago. Alas, there is no plaque, no memorial, not even a storyboard to explain the significance of this place to residents and visitors. It's an important piece of our history and it's being completely ignored. Some might feel that to be interested in Ronan Point is a little ghoulish, but after half a century almost all the immediate actors in the event will have passed on, and it's an important event in the history of 20th century Britain. It still has resonance.

In fact, it took a little detective work on my part to work out just where the Ronan Point tower had once stood. There were lots of aerial photos taken after the explosion, but this doesn't make it easy to place it because many of the surrounding streets have been rebuilt, often with new alignments. But there are one or two key photos on the web which, together with other useful bits of information, place the tower block exactly. None more so than the one which shows the address of Ronan Point as 85 Butchers Road.


There are others in which you can make out the side streets, Ashburton Road and Fords Park Road, to the west of Butchers Road, which still follow the Victorian street pattern. Butchers Road is the street that runs diagonally across the image below, from bottom left to top right.

And there is the recorded fact that the site , after demolition, was developed by Barratts in their inimitable 1990s Noddy-style, complete with GRP porch canopies. It's these Barratt houses, arranged in two terraces stretching between Butchers Road and Freemasons Road, that mark out the surprisingly small footprint of the Freemasons Estate. Ronan Point was the westernmost tower. In fact, there is still a No 85 Butchers Road, which marks the entrance of the only Barratt home to face Butchers Road itself, just to the south of the Butchers Road Newsagents. That, near as damn it, was where the tower once stood.

I you are interested in finding out where it happened and, en route, getting to see a fascinating if still deprived part of the East End, the pin on my Google Map marks the spot. It's a 15 minute walk from the Custom House DLR station and an easy side tour for those visiting Excel.


Here are some mood-capturing images I snapped from my iPhone last Sunday morning.
The newsagent is just to the north of the site. Ronan Point would have once towered over it.
The electricity sub station is on Butchers Road by the entrance to Goldwing Close. It's very close to the site of Ronan Point.  

This Barratt house on Goldwing Close is more or less on the spot where the tower stood. These houses are now 20 years old and they haven't aged well.


17 Sept 2015

Selfbuild under academic scrutiny

Selfbuild can be a slippery concept. It has a definition which seeks to differentiate it from other kinds of build: it's that the project is conceived and executed by people for their own use. But is that in itself exceptional or noteworthy, and does it justify the amount of column inches that get spent lauding selfbuild as if it's the answer to our housing problems? Probably not.

This question is asked in the latest piece of academic research which has been carried out by Michaela Benson, a Senior Lecturer in Sociology at Goldsmiths in London. It's not often that academics turn their attention to selfbuild. In fact you can count the number of serious attempts at analysis on the fingers of one hand so it's always interesting to hear what they make of the selfbuild industry. As with others before her, Michaela Benson struggles with the very individualistic nature of selfbuild which makes conclusion-drawing problematic. But she does have one or two insights that are fascinating.

One is that, of the 16 selfbuild stories she puts under the microscope, they all have problems reconciling their budgets with spiralling costs and that they all seem to run into financial stress at some point. She concludes that selfbuild mortgages aren't all they are cracked up to be, as the fronted sums never seem to be enough to meet the bills. And related to all this, there is almost always some sort of falling out with professionals encountered on the journey. Architects can go from hero to zero in the face of unforeseen cost shocks. Contractors fall by the wayside as timetabling slips hopelessly. Specialist suppliers screw up badly, throwing the project timetabling into disarray. New techniques and technologies are embraced by the selfbuilders but often flummox the contractors. People met along the way often promise much but deliver little.

But she also concludes that these problems are not unique to selfbuild. In fact they are pretty much endemic to construction, certainly as widely practiced in the UK. Apart from a small number of community-organised schemes (which receive a disproportionate amount of media interest), selfbuild in England is a very middle class affair, taken on by people with good education, substantial earnings and/or assets and usually with some experience of management. In other words, the privileged few. That they so frequently run into problems probably says more about the chaotic nature of construction that it does about their own inadequacies.

To be fair to the selfbuild media, these conclusions are hardly a surprise. In fact this narrative lies at the heart of most episodes of Grand Designs. Plucky couple take on taxing project at considerable risk to their wealth and health; after facing many hazards along the way, they emerge bruised, battered but triumphant. Benson's research more or less confirms this stereotype.

The one conclusion that she draws from her study that is perhaps unconventional is a call for individual selfbuilders to better manage the social relationship side of their jobs. When the relationships break down, the job suffers and the cash management goes out the window. Which is perhaps an academic way of saying try and keep people sweet.

I am reminded of a couple of selfbuilds I have written about where the selfbuilders puts an enormous amount of effort and quite a bit of cash into keeping subcontractors on board. One arranged to have the fish and chip van arrive on site every Friday so that everyone working there got a slap-up lunch. Amazing how often this resulted in a full crew turning up every Friday. The other tipped his subbies over and above what their gaffer was paying them. He ended up tipping over £1500 in total, but reckons it was money well spent, as standards were excellent and there were very few callbacks. People respond to generosity, and goodwill gestures are often good investments in themselves.

Micahela Benson's report, The Social in Selfbuild, is officially launched on Friday 18th September at the Geffrye Museum and will be made available via her online blog later that day.